
Empower Your Home, Enrich Your Future
Sign-in or signup

Batteries and Energy Storage Elaboration
This Secftion contains a list of detailed information.
While it contains links to other pages on this platform, you should understand that one may press the browser Back button to return to a prior web page or one of the menu's to navigate.
Key Implementation Issues for Consumers
While residential consumer batteries offer many benefits, there are also some key implementation issues that homeowners should consider before installing an energy storage system. Here are some of the main issues that homeowners may face:
Cost:
One of the biggest implementation issues for consumers is the cost of installing a residential consumer battery system. While the cost of batteries has been decreasing in recent years, it can still be a significant investment for homeowners. In addition to the cost of the battery itself, homeowners will also need to factor in the cost of installation, permits, and any necessary upgrades to their electrical system.
Compatibility:
Another issue to consider is compatibility. Not all batteries are compatible with all solar panel systems, so homeowners will need to ensure that the battery they choose is compatible with their existing system or plan to install a compatible solar panel system if they don't already have one.
Maintenance: Like any other technology, batteries require maintenance to ensure that they operate properly and last as long as possible. Homeowners will need to make sure that they understand the maintenance requirements for their specific battery system and are prepared to follow the recommended maintenance schedule.
Regulation and permitting:
Another implementation issue that homeowners may face is navigating the various regulations and permitting requirements related to installing a battery system. Depending on where they live, homeowners may need to obtain permits from their local government and comply with various regulations related to energy storage and electrical systems.
Backup power:
While batteries can provide backup power during outages, homeowners will need to ensure that their battery system is designed to provide the necessary power for their specific needs. This may require sizing the battery system appropriately and ensuring that it is configured to provide power to critical loads during outages.
These are just a few of the key implementation issues that homeowners may face when installing a residential consumer battery system.
While these issues can be challenging, many homeowners find that the benefits of energy storage outweigh the costs and effort involved in implementing the system.
Market Leaders
Who are the market leaders in terms of engineering innovation, value, and quality?
There are several companies that are considered market leaders in the residential consumer battery industry in terms of engineering innovation, value, and quality.
Here are a few examples (as of late 2024):
Tesla: Tesla is one of the most well-known companies in the energy storage industry, thanks to its Powerwall and Powerpack products. Tesla's products are known for their sleek design, high-quality components, and advanced software features, such as the ability to automatically switch between grid power and battery power during outages.
LG Chem: LG Chem is a South Korean company that produces a wide range of batteries, including lithium-ion batteries for residential energy storage. LG Chem's batteries are known for their high energy density and long cycle life, making them an attractive option for homeowners looking for a high-quality and durable battery.
Sonnen: Sonnen is a German company that produces lithium-ion batteries for residential energy storage. Sonnen's batteries are known for their advanced software features, such as the ability to store excess solar energy and use it during peak demand periods. Sonnen also offers a unique community energy storage program, which allows homeowners to share energy with their neighbors.
Enphase Energy: Enphase Energy is a California-based company that produces microinverters and energy storage systems for residential and commercial customers. Enphase's batteries are designed to work seamlessly with its microinverter technology, allowing homeowners to easily integrate solar panels and batteries into their homes.
SunPower: SunPower is a solar panel manufacturer that also offers energy storage solutions for residential customers. SunPower's batteries are known for their high efficiency and advanced monitoring capabilities, which allow homeowners to track their energy usage in real-time.
These companies are just a few examples of the market leaders in the residential consumer battery industry. Other companies, such as Panasonic, ESS Inc., and SimpliPhi Power, are also worth considering for their engineering innovation, value, and quality.
Ultimately, the best choice for a homeowner will depend on their individual needs and preferences, as well as factors such as budget, location, and energy usage patterns.
Battery System Life Cycle Cost Analysis
In the section we analyze the lifecycle costs of battery storage systems, focusing on total cost of ownership (TCO) and return on investment (ROI) metrics.?
There are three system options (Basic, Mid-level, Large) and two scenarios (with and without various incentives).
Summary:
Without consideration of incentives (representative cash flow) - Key insights from this lifecycle analysis:
-
Economies of scale are significant - larger systems have better economics per kWh despite higher absolute costs.
-
The sweet spot for ROI appears to be in the mid-range systems (around 27 kWh), balancing:
-
Installation efficiency
-
Operational costs
-
Revenue potential
-
Component replacement timing
-
-
Component replacement strategy is crucial:
-
Inverter replacement timing can significantly impact TCO
-
Battery module failures increase substantially after warranty period
-
Preventive maintenance can extend component life and improve ROI
-
With consideration of incentives (using Boulder County, Colorado as representative geographic location) - Key insights from this lifecycle analysis:
-
Substantial utility incentives through Xcel Energy's (the local utility) battery storage program
-
Local EnergySmart rebates (County Program)
-
State tax benefits
-
Federal tax incentives
The combination of these benefits transforms the economics, making even the basic system financially viable and the larger systems significantly profitable over their lifecycle. Key observations:
-
Payback periods are reduced by more than 50%
-
IRR increases to levels competitive with many other investments
-
Larger systems become even more attractive due to economies of scale in installation and better capture of available incentives
Battery Storage System Lifecycle Cost Analysis
(15-Year Period)
Initial Capital Costs
Hardware Costs (By System Size)
-
Basic System (13.5 kWh)
-
Battery unit: $8,500
-
Inverter: $3,000
-
Monitoring system: $500
-
Total: $12,000
-
-
Mid-Range System (27 kWh)
-
Battery units: $17,000
-
Inverter: $4,500
-
Monitoring system: $500
-
Total: $22,000
-
-
Large System (40.5 kWh)
-
Battery units: $25,500
-
Inverter: $6,000
-
Monitoring system: $500
-
Total: $32,000
-
Installation Costs
-
Basic electrical work: $2,500
-
Panel upgrades: $2,000
-
Permits and inspections: $500
-
Labor (varies by system size):
-
Basic: $3,000
-
Mid-Range: $4,500
-
Large: $6,000
-
Operational Costs (Annual)
Energy Losses
-
Round-trip efficiency losses: 10-15%
-
Annual cost impact (@$0.15/kWh):
-
Basic: $150
-
Mid-Range: $300
-
Large: $450
-
Maintenance Costs
-
Preventive Maintenance
-
Annual inspection: $200
-
Firmware updates: $100
-
System cleaning: $150
-
Total: $450/year
-
-
-
Component Replacement
-
Years 1-5: Covered by warranty
-
Years 6-10: 2% failure rate ($500/year avg)
-
Years 11-15: 5% failure rate ($1,200/year avg)
-
- Battery module replacements:
-
Inverter replacement (Year 10): $3,000-6,000
Degradation Impact
Capacity Loss
-
Annual degradation: 2.5%
-
Cumulative capacity loss:
-
Year 5: 12%
-
Year 10: 23%
-
Year 15: 32%
-
Financial Impact
-
Replacement power costs (@$0.15/kWh):
-
Basic: $75/year increasing to $180/year
-
Mid-Range: $150/year increasing to $360/year
-
Large: $225/year increasing to $540/year
-
Revenue/Savings Streams
Peak Load Shifting
Annual savings:
-
Basic: $800-1,000
-
Mid-Range: $1,600-2,000
-
Large: $2,400-3,000
Demand Response Programs
Annual revenue:
-
Basic: $500
-
Mid-Range: $1,000
-
Large: $1,500
Backup Power Value
(Based on avoided outage costs)
-
Residential value: $150/day of outage
-
Annual expected value:
-
Basic: $450 (3 events/year)
-
Mid-Range: $900 (6 events/year)
-
Large: $1,350 (9 events/year)
-
Side-by-Side Analysis Results
The summary results of this analysis are tabulated and presented below:
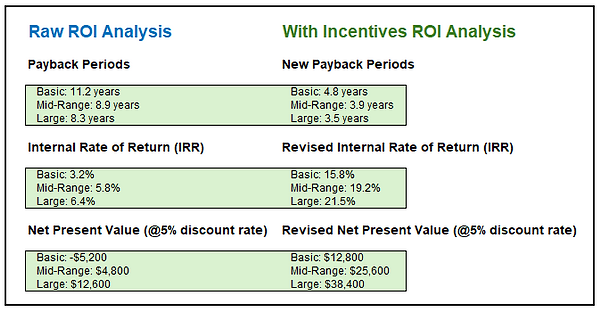%2020241203_PNG.png)
This table (as per this sample analysis) shows the economic viability of a battery energy storage, as per a higher rate of return than an investment in the stock market .
Other economic issues: This investment may increase the resale value of the residential owner's home 3%-4%.
Please note: This analysis is for illustrative purpose and is not a guarantee of the presented returns, which are best understood by the application of those incentives represent in specific locations.
Baseline Assumptions for an "Average" American Home
This analysis provides a comprehensive overview of battery storage options and their implications. A few key points to highlight from an asset investment perspective:
-
Battery storage systems represent a significant capital investment with a clear degradation curve, making lifecycle management crucial.
-
The cost per kWh of storage increases non-linearly with backup duration due to:
-
Additional integration complexity
-
Space constraints requiring premium solutions
-
Higher maintenance requirements
-
-
The existing 5kW solar PV system helps offset daily usage but may not charge larger battery systems quickly enough during adverse weather, potentially requiring additional solar capacity for longer backup scenarios.
Daily Energy Consumption
-
Average US household: 30 kWh/day
-
Peak demand: 5-7 kW
-
Existing solar: 5 kW system generating ~20 kWh/day (location dependent)
How Battery Storage Works
Battery storage systems for residential use primarily employ lithium-ion technology, specifically:
-
Lithium Iron Phosphate (LFP): Safer, longer lifecycle, lower energy density
-
Lithium Nickel Manganese Cobalt (NMC): Higher energy density, shorter lifecycle
Key Operating Parameters:
-
Depth of Discharge (DoD): Typically 85-95%
-
Round-trip efficiency: 85-90%
-
Cycle life: 5,000-10,000 cycles
-
Calendar life: 10-15 years
-
Degradation rate: 2-3% per year
Current Market Offerings Analysis
Entry Level Systems (10-15 kWh)
-
Examples: Tesla Powerwall, Enphase IQ Battery
-
Capacity: 13.5 kWh usable (Tesla)
-
Charge/discharge rate: 5-7 kW continuous
-
Cost range: $8,000-12,000 installed
-
Backup duration: ~12 hours for average home
Mid-Range Systems (15-30 kWh)
-
Examples: LG RESU Prime, SonnenCore
-
Capacity: 16-20 kWh usable
-
Charge/discharge rate: 7-9 kW continuous
-
Cost range: $15,000-25,000 installed
-
Backup duration: 1-2 days for average home
High-Capacity Systems (30+ kWh)
-
Examples: Sonnen eco, Multiple Powerwall
-
Capacity: 30-40 kWh usable
-
Charge/discharge rate: 8-12 kW continuous
-
Cost range: $30,000-45,000 installed
-
Backup duration: 3-4 days for average home
One Day Backup (30 kWh required)
-
System size needed: 35 kWh (accounting for efficiency losses)
-
Approximate cost: $25,000-35,000
-
Typical configuration: 2-3 battery units
-
Annual degradation impact: 600-900 kWh loss over 10 years
Three Day Backup (90 kWh required)
-
System size needed: 100 kWh
-
Approximate cost: $60,000-80,000
-
Typical configuration: 6-8 battery units
-
Annual degradation impact: 1,800-2,400 kWh loss over 10 years
One Week Backup (210 kWh required)
-
System size needed: 230 kWh
-
Approximate cost: $140,000-180,000
-
Typical configuration: 15-17 battery units
-
Annual degradation impact: 4,200-5,400 kWh loss over 10 years
Implementation Considerations
-
Physical Space Requirements:
-
Multiple unit installations require dedicated mechanical room
-
-
Single unit footprint: ~30" x 60" wall space
-
Electrical Integration:
-
Main panel upgrade often required: $2,000-4,000
-
Transfer switch installation: $1,000-2,000
-
Possible service entrance modifications
-
-
Permitting and Inspection:
-
Local electrical permits: $200-1,000
-
Fire safety requirements: Additional cost varies by jurisdiction
-
Battery Storage System Optimization Strategies
Summary: We'll analyze optimization issues and strategies for battery storage systems, focusing on maximizing the return on investment while ensuring reliable backup power.
From this analysis, several key optimization principles emerge:
-
Load management is often more cost-effective than additional battery capacity. Smart load management can reduce required battery capacity by 15-25%.
-
Hybrid approaches (battery + generator) become increasingly cost-effective for longer backup durations. For one-week backup scenarios, this can reduce battery capacity requirements by up to 25%.
-
Temperature management and charge cycle optimization can significantly extend battery life, with potential lifecycle increases of 25-35%.
Core Optimization Objectives
-
Maximize financial return
-
Ensure reliable backup power
-
Extend system lifespan
-
Optimize integration with Solar PV
Daily Operation Strategies
Peak Load Shifting
-
Monitor Time-of-Use (TOU) rates
-
Charge during off-peak (typically 2AM-6AM): $0.08-0.12/kWh
-
Discharge during peak (typically 4PM-9PM): $0.30-0.50/kWh
-
Annual savings potential: $800-1,200 for 13.5kWh system
Solar Integration
-
Primary charging window: 10AM-2PM (peak solar production)
-
Target 80% charge by 3PM (pre-peak rate period)
-
Reserve 20% capacity for unexpected events
-
Projected additional solar self-consumption: 25-35%
Demand Response Programs
-
Utility incentives: $100-200/kW-year
-
Program requirements: 10-20 events/year
-
Average event duration: 2-4 hours
-
Potential annual revenue: $500-1,000
Backup Power Optimization
Essential Loads Strategy
-
Tier 1 (Critical):
-
HVAC: 3.5 kW
-
Refrigeration: 1 kW
-
Basic lighting: 0.5 kW
-
Total: ~5 kW, 15 kWh/day
-
-
Tier 2 (Important):
-
Water heater: 4.5 kW
-
Cooking: 2.5 kW
-
Additional lighting: 1 kW
-
Total: ~8 kW, 10 kWh/day
-
-
Tier 3 (Convenience):
-
Remaining circuits
-
Total: ~4 kW, 5 kWh/day
-
Load Shedding Configuration
-
Automated load management system: $800-1,200
-
Smart breaker panel: $2,000-3,000
-
ROI period: 3-4 years through improved efficiency
System Sizing Optimization
One Day Backup
-
Optimized capacity: 25 kWh (vs. 30 kWh standard)
-
Achievement method:
-
Smart load management
-
Peak solar utilization
-
Weather-based pre-charging
-
-
Cost reduction: $5,000-8,000
Three Day Backup
-
Optimized capacity: 75 kWh (vs. 90 kWh standard)
-
Strategy:
-
Essential loads only
-
Solar + battery coordination
-
Predictive weather charging
-
-
Cost reduction: $15,000-20,000
One Week Backup
-
Optimized capacity: 160 kWh (vs. 210 kWh standard)
-
Approach:
-
Critical loads only
-
Generator hybrid system
-
Advanced energy management
-
-
Cost reduction: $30,000-40,000
Lifecycle Optimization
Temperature Management
-
Optimal operating range: 65-75°F
-
HVAC integration cost: $1,500-2,500
-
Extended lifespan benefit: 15-20%
Charge Cycle Management
-
Maximum daily cycles: 1
-
Depth of discharge limit: 85%
-
Projected cycle life extension: 25%
-
Additional usable capacity: 1,000-1,500 cycles
Predictive Maintenance
-
Quarterly capacity testing
-
Annual efficiency verification
-
Bi-annual thermal imaging
-
Cost: $200-400/year
-
Benefit: 10-15% longer system life
Key Points for Full Value Attainment
This section presents key points related to failure to meet production and productivity goals in residential facilities and the key points related to success in meeting these criteria in an easily digestible outlined format.
Other detailed issues are described in the "Life Cycle" section of this platform.
FAILURE FACTORS:
Poor Planning/Installation:
Wrong system size for home needs
Incorrect panel orientation
Poor roof condition underneath
Shade issues not considered
Low-quality components used
Improper wiring
Wrong inverter sizing
Environmental Issues:
Unexpected shade from tree growth
Excessive dust/dirt buildup
Bird/animal damage
Weather damage
Higher temperatures than planned
Snow coverage
Local climate changes
Maintenance Problems:
Neglected cleaning
Missed inspections
Delayed repairs
Ignored warning signs
Poor monitoring
Incorrect cleaning methods
SUCCESS FACTORS:
Proper Planning:
Detailed site analysis
Correct system sizing
Quality components
Professional installation
Good roof condition
Proper permits
Advanced monitoring systems
Installation Best Practices:
Optimal panel angle
Correct orientation
Professional wiring
Proper ventilation
Strong mounting system
Quality inverters
Backup systems if needed
System Management:
Regular monitoring
Quick problem response
Performance tracking
Professional maintenance
Good warranty coverage
Owner education
KEY MAINTENANCE TASKS:
Regular Inspections (Every 3-6 months):
Check for physical damage
Look for loose connections
Monitor performance data
Inspect mounting hardware
Check inverter operation
Review energy production
Cleaning Requirements:
Remove dust and dirt
Clear debris
Clean bird droppings
Remove snow (if needed)
Clear leaves
Check for water damage
Professional Maintenance (Yearly):
Test electrical connections
Check inverter performance
Inspect roof integrity
Test safety systems
Update monitoring software
Check battery systems
System Monitoring:
Track daily production
Compare to expected output
Watch for performance drops
Monitor weather impacts
Check error messages
Record maintenance dates
Long-term Care:
Replace inverter (10-15 years)
Update monitoring systems
Check warranty coverage
Evaluate system upgrades
Plan for panel replacement
Track efficiency changes
Preventive Measures:
Protection Systems:
Critter guards
Lightning protection
Surge protection
Temperature controls
Emergency shutoffs
Weather shields
DOCUMENTATION:
Keep maintenance records
Track performance data
Save warranty information
Record repair history
Document weather events
Keep installer contacts
OWNER EDUCATION
Understanding system basics
Recognizing problems
Knowing when to call pros
Basic troubleshooting
Emergency procedures
Performance expectations
Battery Energy Storage Versus Generators
In the context of residential Renewable energy implementation, one can make a somewhat casual observation that with the current state of battery storage technology and the pricing curve it may make more sense the have a backup generator than battery battery power storage.
What are the observations regarding this perspective?
Let's break down the key three considerations:
Economic Factors:
- Current (early 2025) residential battery systems like the Tesla Powerwall or LG RESU typically cost $8,000-15,000 installed, while a quality whole-house generator might cost $3,000-7,000 installed
- Batteries generally have a 10-15 year lifespan, while generators can last 20+ years with proper maintenance
- Generators require ongoing fuel costs and maintenance, but these are often lower than the amortized cost of battery replacement
Functional Considerations:
- Batteries provide seamless power transition and can be used daily for peak shifting/arbitrage
- Generators have essentially unlimited runtime as long as fuel is available
- Batteries degrade over time, losing capacity
- Generators work regardless of previous solar/grid conditions, while batteries need to have been charged
- Batteries are silent and require minimal maintenance
- Generators require regular testing and maintenance, make noise, and produce emissions
The cost-benefit analysis often depends on specific use cases:
- If the primary goal is emergency backup power, generators often provide better value, especially in areas with infrequent but potentially long outages
- If the goal includes daily energy optimization (load shifting, self-consumption optimization), batteries become more compelling despite higher costs
- In areas with frequent short outages, batteries might be preferable due to seamless switching and lower maintenance
The observation about current battery pricing is generally sound - the technology isn't yet at a price point where it clearly dominates generators for pure backup purposes.
However, this could change as battery prices continue to decline and energy arbitrage opportunities increase.
If we look at these options and focus on the key three scenarios ...
Scenario 1 - Emergency Backup Focus
In regions prone to severe weather events like hurricanes, ice storms, or areas with vulnerable grid infrastructure that might lead to extended outages lasting days or weeks, a generator system often proves more practical and cost-effective.
Consider a homeowner in rural Florida dealing with hurricane season - they might face multiple days without power. A generator running on propane or natural gas can provide continuous power for essential systems (HVAC, refrigeration, well pumps) as long as fuel is available. While the initial investment is lower than batteries, the real advantage comes in these extended situations where batteries would likely be depleted.
The maintenance costs and occasional fuel purchases are essentially an insurance premium for guaranteed power availability.
The main tradeoffs are noise, emissions, and the need for regular maintenance checks, but these downsides are often acceptable given the robust backup capability.
Scenario 2 - Daily Energy Optimization (for example, "Off Grid")
This scenario typically applies to homeowners in areas with time-of-use electricity rates or significant solar installations. Here, batteries become more compelling despite their higher upfront cost because they're used daily, not just during emergencies.
For example, a homeowner in California with solar panels and evening peak electricity rates could use batteries to store excess solar production during the day and avoid expensive grid power in the evening. The battery system might shift 10-20 kWh of energy daily, potentially saving hundreds of dollars annually through rate arbitrage and optimal solar self-consumption.
Additionally, these systems provide backup power as a secondary benefit.
The economics improve because the system serves multiple purposes - daily cost savings plus emergency backup - rather than sitting idle waiting for an outage.
Scenario 3 - Frequent Short Outages
This situation is common in areas with aging grid infrastructure or frequent minor disruptions - think brief outages lasting minutes to a few hours occurring multiple times per month. A battery system shines here because of its instantaneous response time and zero maintenance between events.
Consider a home office worker in an area with unstable grid power - even momentary outages can disrupt work, crash computers, or reset critical equipment.
A battery system provides seamless power transition that's essentially unnoticeable, maintaining productivity and protecting sensitive electronics. While a generator could serve this purpose, the frequent starting/stopping cycles would increase wear and maintenance needs, and the regular noise disruption would be problematic in a work-from-home environment.
The higher cost of batteries becomes more justifiable when factoring in the quality-of-life improvements and reduced business disruption.
In each case, the local electricity rate structure, grid reliability patterns, and intended use case significantly influence which solution provides better value. The decision isn't just about comparing direct costs, but rather understanding how each solution aligns with specific needs and usage patterns.
Battery Disposal Issues
This section discusses the issues of battery disposal and recycling issues. There are perspectives given great publicity to what happens to batteries when they go our of service
What are the observations regarding this perspective?
Let's break down the key three considerations:
The increasing adoption of electric vehicles (EVs) and residential storage batteries raises valid concerns about recycling and waste disposal. Here are some key concerns related to the current generation of EV and residential storage batteries:
1. Material Recovery:
EV and residential storage batteries contain valuable and potentially hazardous materials such as lithium, cobalt, nickel, and other metals. Proper recycling and waste disposal processes are necessary to recover these materials for reuse and minimize environmental impact. However, the current infrastructure for battery recycling is not fully developed, leading to concerns about the efficient and effective recovery of materials.
2. Recycling Capacity and Technology:
The demand for battery recycling is growing rapidly, and it is crucial to develop the necessary recycling capacity and technology to meet this demand. Advanced recycling technologies that can efficiently recover and separate battery materials are still being developed and implemented. Scaling up recycling facilities and improving the efficiency of recycling processes are essential to address this concern.
3. Environmental Impact:
Improper disposal of EV and residential storage batteries can have significant environmental consequences. Batteries that end up in landfills can release toxic chemicals and heavy metals, posing risks to soil and water contamination. It is crucial to ensure proper waste management practices to minimize environmental impact and prevent the potential negative effects on ecosystems and human health.
4. End-of-Life Management:
The end-of-life management of EV and residential storage batteries is a complex challenge. Battery systems typically have a long lifespan, but eventually, they reach the end of their usable life. Proper disposal or recycling at the end of life is crucial to prevent batteries from becoming hazardous waste and to recover valuable materials. Developing effective collection systems and implementing appropriate recycling processes are essential for sustainable end-of-life management.
5. Regulatory Frameworks:
Clear and robust regulatory frameworks are necessary to ensure responsible recycling and waste disposal of EV and residential storage batteries. Governments and regulatory bodies need to establish and enforce regulations that promote proper handling, recycling, and disposal practices. This includes implementing regulations for extended producer responsibility, which holds manufacturers accountable for the recycling and waste management of their products.
Addressing these concerns requires collaboration between stakeholders, including battery manufacturers, recycling companies, governments, and consumers. Investments in research and development, infrastructure, and recycling technologies are essential to establish a sustainable and efficient battery recycling ecosystem. Additionally, raising awareness among consumers about the importance of proper battery disposal and encouraging participation in recycling programs can contribute to mitigating these concerns.
Yes, there are examples of established recycling practices and leaders in the field of recycling EV and residential storage batteries.
While the industry is still evolving, several companies and organizations have made significant progress in battery recycling.
Here are a few examples:
1. Umicore: Umicore is a global materials technology and recycling company that has expertise in battery recycling. They have established recycling facilities for various types of batteries, including those used in EVs and residential storage. Umicore uses advanced recycling technologies to recover valuable metals like cobalt, nickel, and lithium from spent batteries.
2. Li-Cycle: Li-Cycle is a battery recycling company that specializes in lithium-ion batteries, including those used in EVs and energy storage systems. They have developed a proprietary recycling technology called the "Spoke & Hub" process, which involves mechanical and hydrometallurgical processing to recover materials. Li-Cycle operates recycling facilities in North America and has partnerships with battery manufacturers and automotive companies.
3. Retriev Technologies: Retriev Technologies is another battery recycling company that focuses on the recycling of lithium-ion batteries. They offer recycling services for various battery types, including those used in EVs. Retriev Technologies has advanced separation and recovery processes to extract valuable metals from spent batteries and works with manufacturers, government entities, and other stakeholders in the battery industry.
4. Call2Recycle: Call2Recycle is a non-profit organization that operates battery recycling programs in the United States and Canada. While they handle a wide range of batteries, they also accept and recycle EV batteries. Call2Recycle works with retailers, municipalities, and manufacturers to collect and properly recycle batteries, including EV batteries.
These companies and organizations demonstrate the progress being made in battery recycling and have established best practices in the field. They employ advanced technologies and processes to maximize material recovery and minimize environmental impact.
Additionally, collaborations between battery manufacturers, recycling companies, and governments are helping to develop standardized recycling practices and improve the recycling infrastructure.
It's important to note that the field of battery recycling is still evolving, and continuous efforts are being made to improve recycling technologies, efficiency, and scalability. As the demand for battery recycling increases, it is expected that more companies and organizations will emerge as leaders in the field and contribute to the development of sustainable recycling practices.
Battery Mining Issues
There seems to be a lot of energy and momentum building for battery mining and production. if you are acting as an ecologist, what are your concerns?
Here are some key concerns:
1. Resource Extraction:
The production of batteries requires the extraction of raw materials such as lithium, cobalt, nickel, and graphite. Mining operations can have significant ecological impacts, including deforestation, habitat destruction, soil erosion, and water pollution. Extracting these resources at a large scale can lead to habitat loss and displacement of local communities, particularly in regions rich in mineral deposits.
2. Water Usage and Contamination:
Mining operations, especially those involving lithium extraction, require significant amounts of water. Water scarcity is a growing concern in many regions, and large-scale mining operations can exacerbate water stress. Moreover, improper handling and disposal of mining waste can lead to the contamination of water sources with heavy metals and chemicals, posing risks to ecosystems and human health.
3. Biodiversity Loss:
Mining activities can have a detrimental impact on biodiversity. Habitat destruction, fragmentation, and pollution associated with mining operations can result in the loss of plant and animal species. Some minerals used in batteries, such as cobalt, have been linked to illegal and unsustainable mining practices that may further contribute to biodiversity loss.
4. Greenhouse Gas Emissions:
The production of batteries involves energy-intensive processes that can result in significant greenhouse gas emissions. The extraction, processing, and transportation of raw materials, as well as the manufacturing and assembly of batteries, contribute to the carbon footprint associated with battery production. The reliance on fossil fuels for energy during these processes can undermine the potential climate benefits of using batteries in renewable energy systems.
5. Waste Management:
Proper disposal and recycling of battery waste are crucial to minimize environmental impacts. Inadequate waste management practices can lead to the release of toxic substances into the environment. Developing efficient and scalable recycling infrastructure and implementing extended producer responsibility programs are essential to ensure the responsible management of battery waste.
Addressing these concerns requires a holistic approach that considers the entire lifecycle of batteries, from resource extraction to end-of-life management. It involves adopting sustainable mining practices, promoting responsible sourcing of raw materials, improving energy efficiency during production, developing recycling infrastructure, and investing in research and development for alternative battery technologies that minimize environmental impacts.
By implementing stringent environmental regulations, supporting sustainable practices, and encouraging transparency and accountability throughout the supply chain, it is possible to mitigate the ecological concerns associated with battery mining and production and work towards a more sustainable energy storage industry.
Water Usage and Contamination
In the context of mining operations, water usage and contamination can vary depending on the specific mining processes and the management practices in place. While water can be recycled and treated to mitigate contamination, there are cases where the water may become permanently toxic or unsuitable for certain uses. Here's a general overview:
1. Water Recycling:
Mining companies often implement water management strategies that aim to reduce freshwater consumption by maximizing water recycling and reuse. Techniques such as sedimentation, filtration, and chemical treatment can be employed to remove contaminants from water, making it suitable for reuse in mining processes. Recycling water within mining operations helps minimize the demand for freshwater resources.
2. Treatment Technologies:
Various treatment technologies can be applied to remove or reduce contaminants from mining wastewater. These technologies may include physical, chemical, and biological processes, depending on the specific contaminants present. Effective treatment can help improve water quality and reduce the environmental impact of mining operations.
3. Tailings Ponds and Contamination:
In some cases, mining operations generate waste materials called tailings, which are often stored in specially designed ponds. If not managed properly, tailings ponds can pose a risk of water contamination. The presence of heavy metals, chemicals, and other pollutants in tailings can potentially leach into surrounding water sources, affecting both surface water and groundwater quality. Effective containment and treatment measures are necessary to prevent or minimize such contamination.
4. Permanent Toxicity:
In certain situations, the water affected by mining activities may contain contaminants that are difficult to remove or treat to a level suitable for human or agricultural use. This can occur when the mining processes involve the release of highly toxic substances or when the water comes into contact with naturally occurring minerals that are inherently toxic. In such cases, the water may be permanently unsuitable for certain uses, and measures must be taken to prevent human or environmental exposure.
It's important to note that the extent and severity of water contamination depend on factors such as the specific mining practices, the type of minerals being extracted, the effectiveness of water management and treatment measures, and local environmental regulations. Responsible mining companies strive to minimize water usage, implement effective water management strategies, and mitigate contamination to ensure the protection of water resources and surrounding ecosystems.
Issues specific to mining lithium ...
rent mining operations, including those involved in lithium mining, may have specific water management and treatment practices in place. The extent of water usage and potential contamination can vary depending on the specific mining techniques employed, the characteristics of the mineral being extracted, and the environmental regulations and practices followed by mining companies.
For lithium mining specifically, water management practices may include strategies to minimize water usage, such as recycling and reuse within the mining process. Water treatment technologies can be applied to remove or reduce contaminants in mining wastewater, depending on the specific contaminants present and the applicable regulations.
It's important to note that the environmental impact of mining operations, including water usage and contamination, can vary depending on several factors, such as the location, mining techniques, and the management practices implemented by mining companies. Therefore, the specific water management and treatment practices used in lithium mining may vary from one operation to another.